We no longer support this browser. Using a supported browser will provide a better experience.
请 更新浏览器.
The 当地的商业 Data Series are a battery of measures which provide a place-based view of local spending. Based upon the credit and debit card transactions made by over 40 million de-identified credit and debit card users across 15 major U.S. 都市区, the series provides decision-makers a view into the local commerce activity happening in their cities.
The downloadable data and figures relate growth rates over one and two years and growth contributions for local commerce for 15 都市区. The “national” view is constructed as the aggregate trend across these 15 areas. For all geographies, growth is broken out by consumer age*, product type (e.g. restaurants), and channel (i.e. online/offline) to help local stakeholders and decision-makers better understand how consumer spending contributes to the economic vibrancy in their cities.
As vaccination rates rise throughout the United States, people are anticipating a “return to normal” in their everyday lives. 直到2021年3月, the prior year provided a useful baseline for assessing differences to pre-pandemic economic activity. 从2021年3月开始, a year-over-year growth measure does not address the question of how local spending compares to pre-pandemic levels. 出于这个原因, we now calculate spending growth compared to both one and two years prior. Presenting growth relative to baselines before and during the 新型冠状病毒肺炎 pandemic allows us to better contextualize the economic activity we observe. 出于这个原因, we will continue to publish both our year-over-year growth series and our comparison of the latest 月 to its pre-pandemic counterpart.
We hope that these data and figures can provide a better understanding of current local economic conditions and serve as useful input into decision making processes. Moreover, we hope that this series provides a view into the data that underlie our 城市 & 当地社区 research, and provide useful context around what forms of inquiries/research we are able to usefully inform. For an example of how our data can be leveraged for decision making, please see our insight “Retail spending response to local conditions during 新型冠状病毒肺炎”, which explores how consumer spending behavior responded to local conditions during the 新型冠状病毒肺炎 pandemic. 请 reach out with any questions, feedback, or inquiries by emailing institute@jpmchase.com.
For a list of frequently asked questions (and their answers), please visit this link.
* The age breakout is currently delayed due to scheduling issues, but will be updated in future releases.
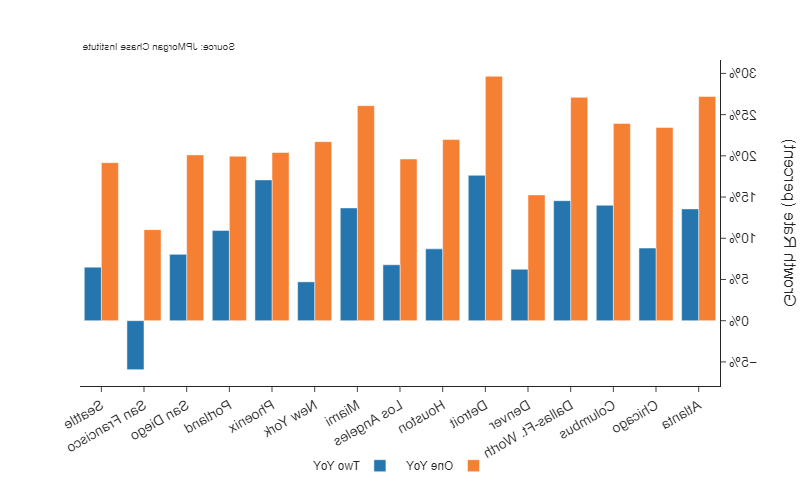
While all 都市区 we track recorded growth relative to March 2020, 旧金山 is the only metro area in which spending remains below what is was in March 2019.
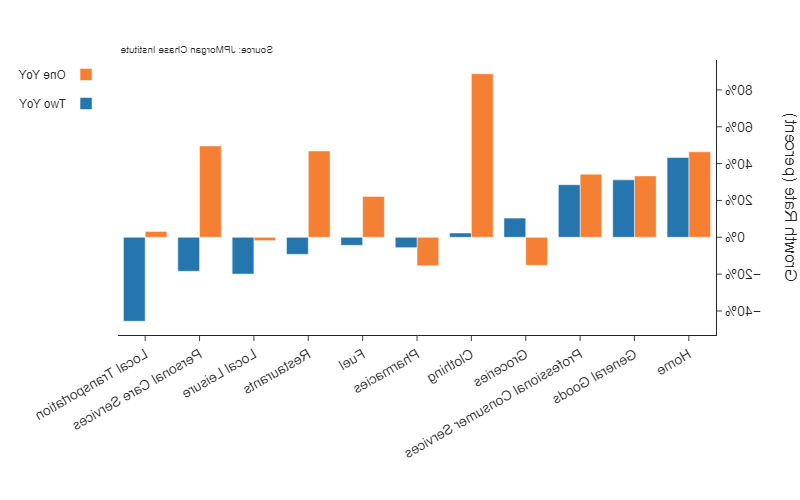
支出 at restaurants and on personal care services is up compared to March 2020 but remains below its 2019 levels. 支出 on local leisure and transportation has not seen strong growth compared to last year and remains far below 2019 levels.
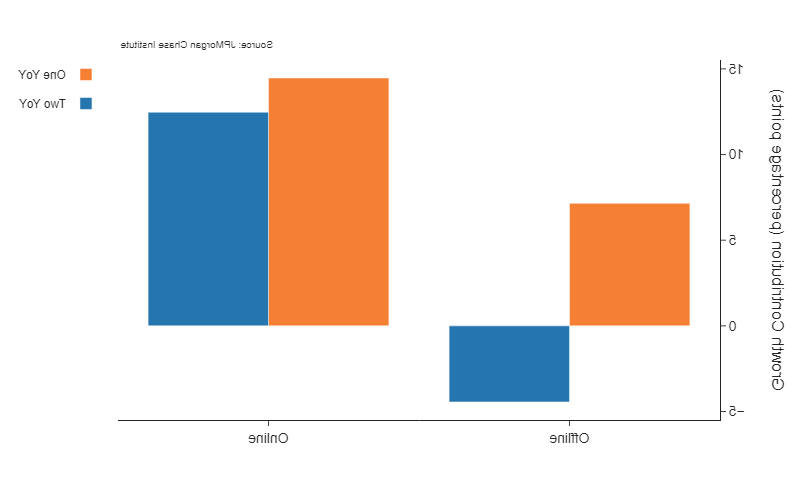
在线 spending continues to drive spending growth, contributing positively to growth over both one and two years.
澳博官方网站app & Co.'s website terms, privacy and security policies don't apply to the site or app you're about to visit. 请 review its website terms, privacy and security policies to see how they apply to you. 澳博官方网站app & Co. isn't responsible for (and doesn't provide) any products, services or content at this third-party site or app, except for products and services that explicitly carry the 澳博官方网站app & Co.